Our method
Our method focuses on the analysis of high dimensional data via Scagnostics arranged on Scatterplot Matrices (SPLOMs). The central of this work is a novel distance metric to compute the dissimilarity of features via their Scagnostics metrics that allows interpreting features according to Scagnostics attributes (by using all available scatter plots of the given feature). The final SPLOMs contains a compact and discriminating set of dimensions. Furthermore, features can be sorted and filtered for further exploration.Scagnostics measures can be interpreted as a measure for certain patterns emergent in two-dimensional scatter plots. Hence, the feature selection technique can be seen as guided by the uniqueness of visual patterns their selection provides. This basically is a visually motivated selection technique which can improve the visual exploration process by selecting those features that give a compact yet diverse set of views.
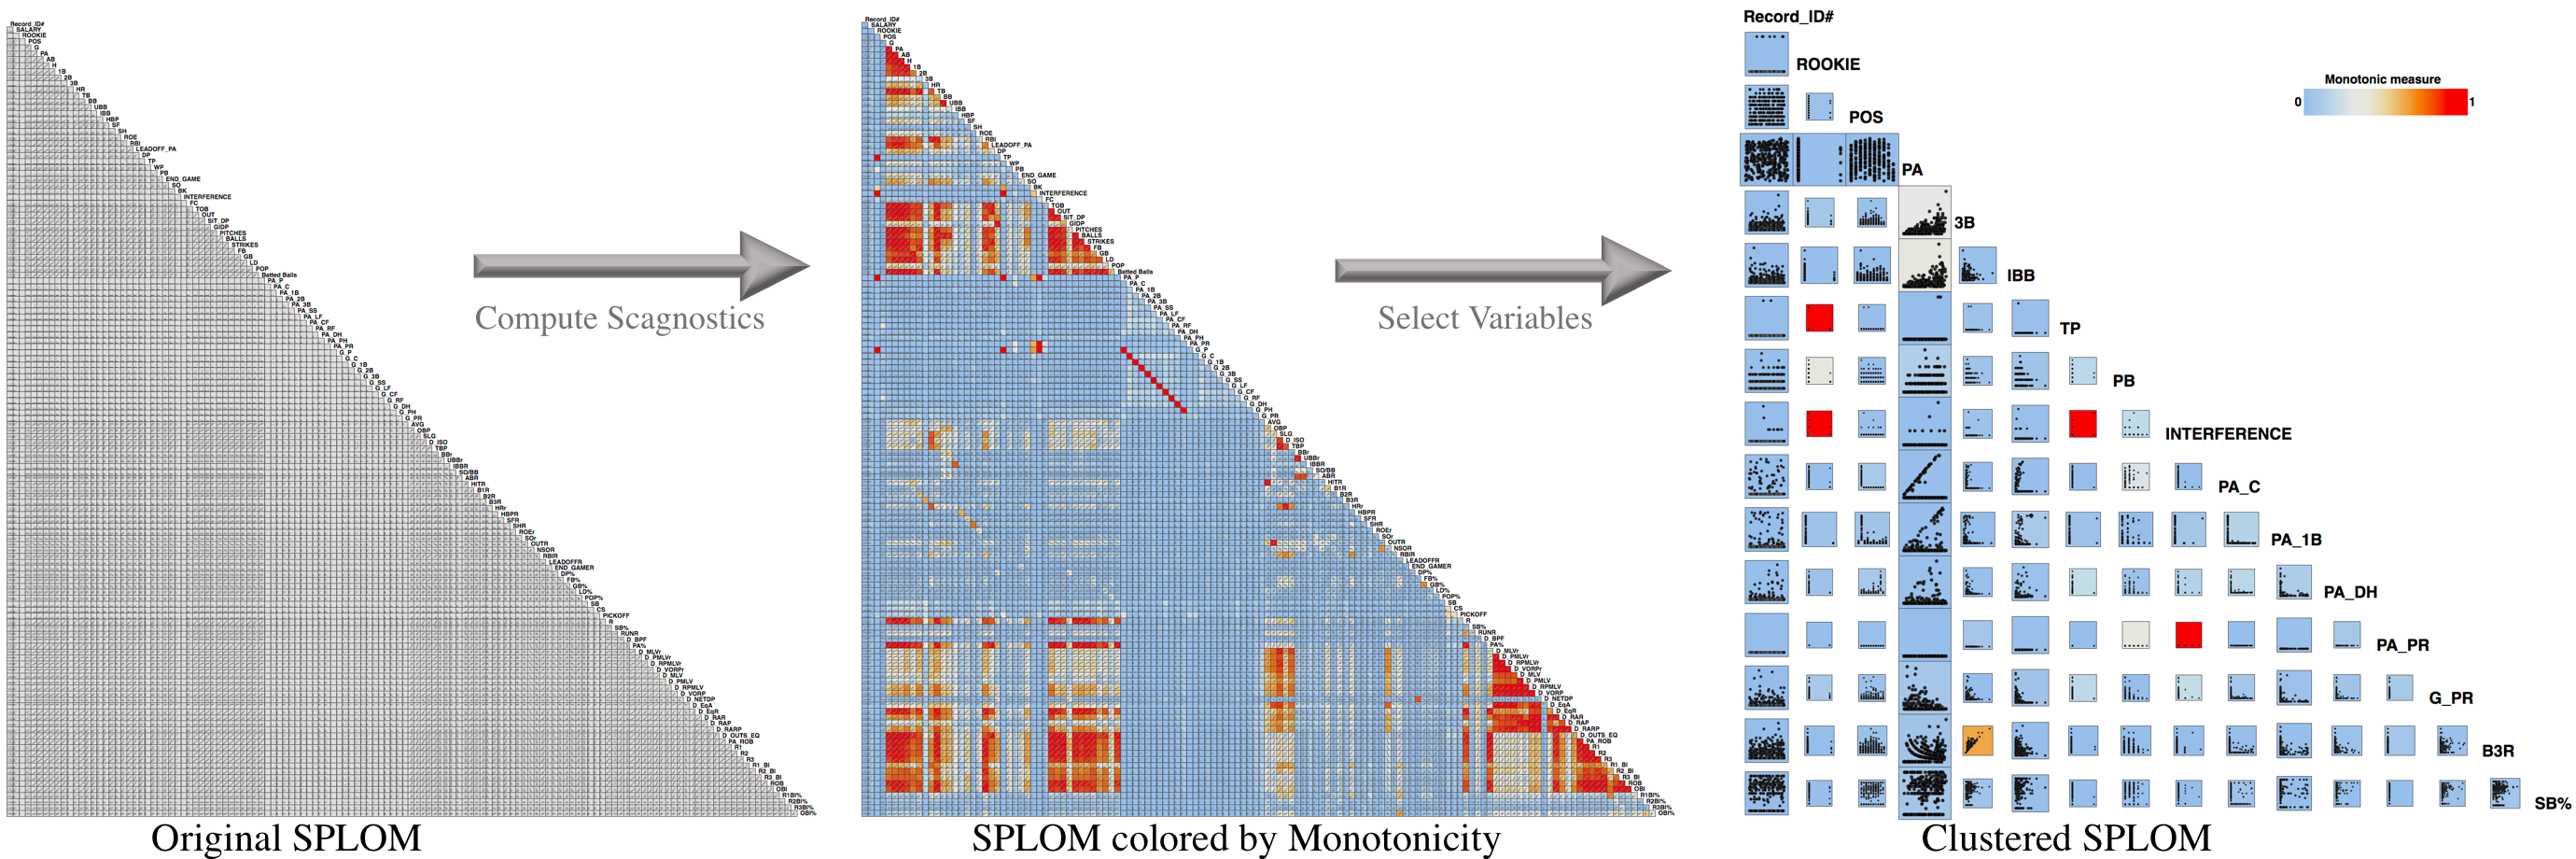
Example of FeatureSelector
The following example shows an example of FeatureSelector on the Major League Baseball data. The data contain 133 variables, which are statistics of 337 players in the 2008 season. Some example attributes include Salary, Double Play Rate, and Batting Average on Balls In Play. Overall, we have totally 8,778 scatterplots (each has 337 data points) to examine. For this dataset, it is not possible to render all data in the original scatterplot (left panel). Instead of working with a large number of variables (133 variables in this case) in the input dataset, our method provides a smaller set of important variables which have a richer mix of visual patterns in resulting plots of the summary SPLOM (right panel).