Figure 8 in the paper shows two example of FeatureSelector compared to ScagExplorer. This page contains 2 additional examples on the 'Major League Baseball' and 'Communities and Crime' data.
The details between two clusters can be shown as a rectangle array of scatterplots by closing on an off-diagonal entry of the SPLOM (the scatterplot of Var 6 vs. Var 18). The consistent patterns of these pairwise projections explain why these redundant variables should be clustered together so that users can focus on important variables in the summary SPLOM.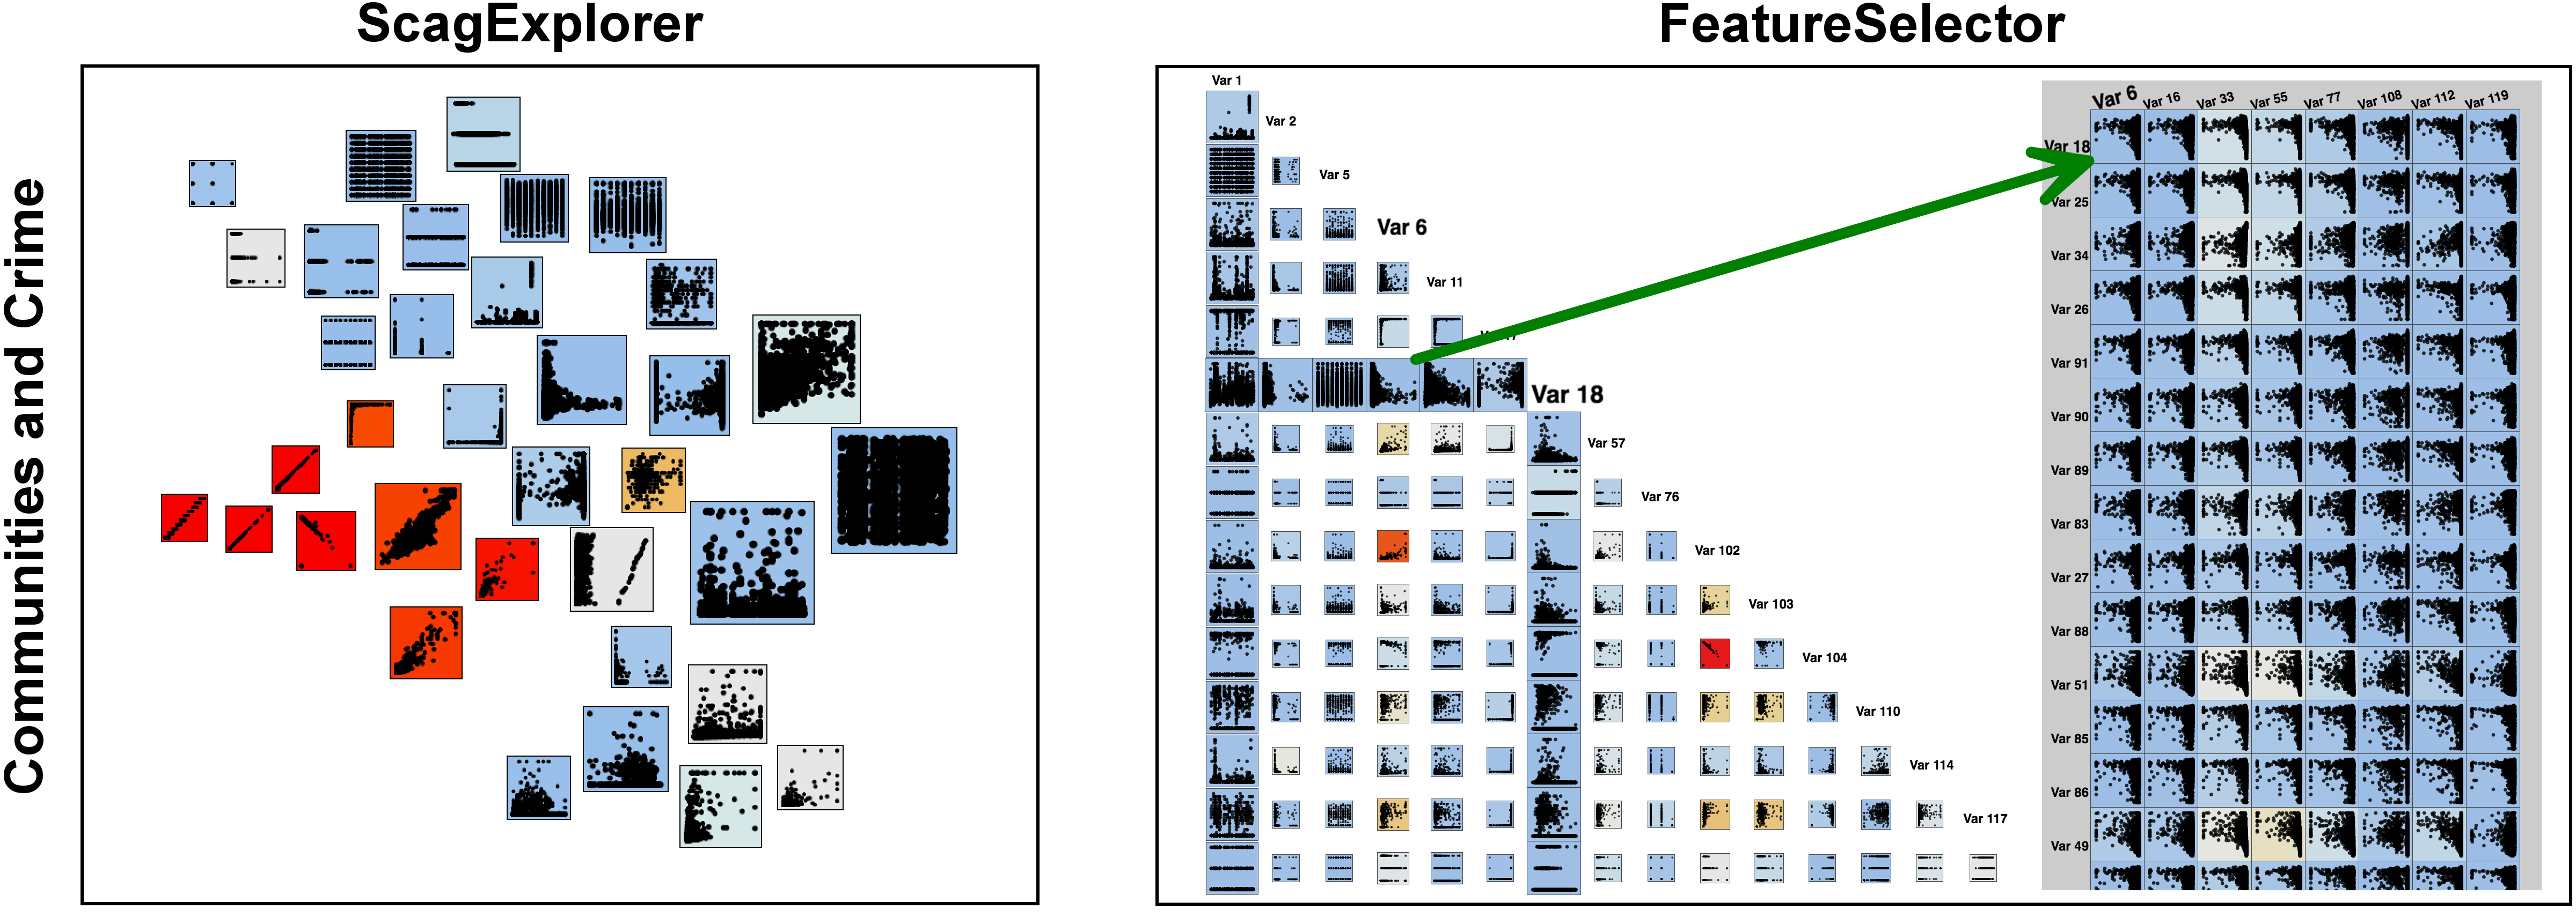
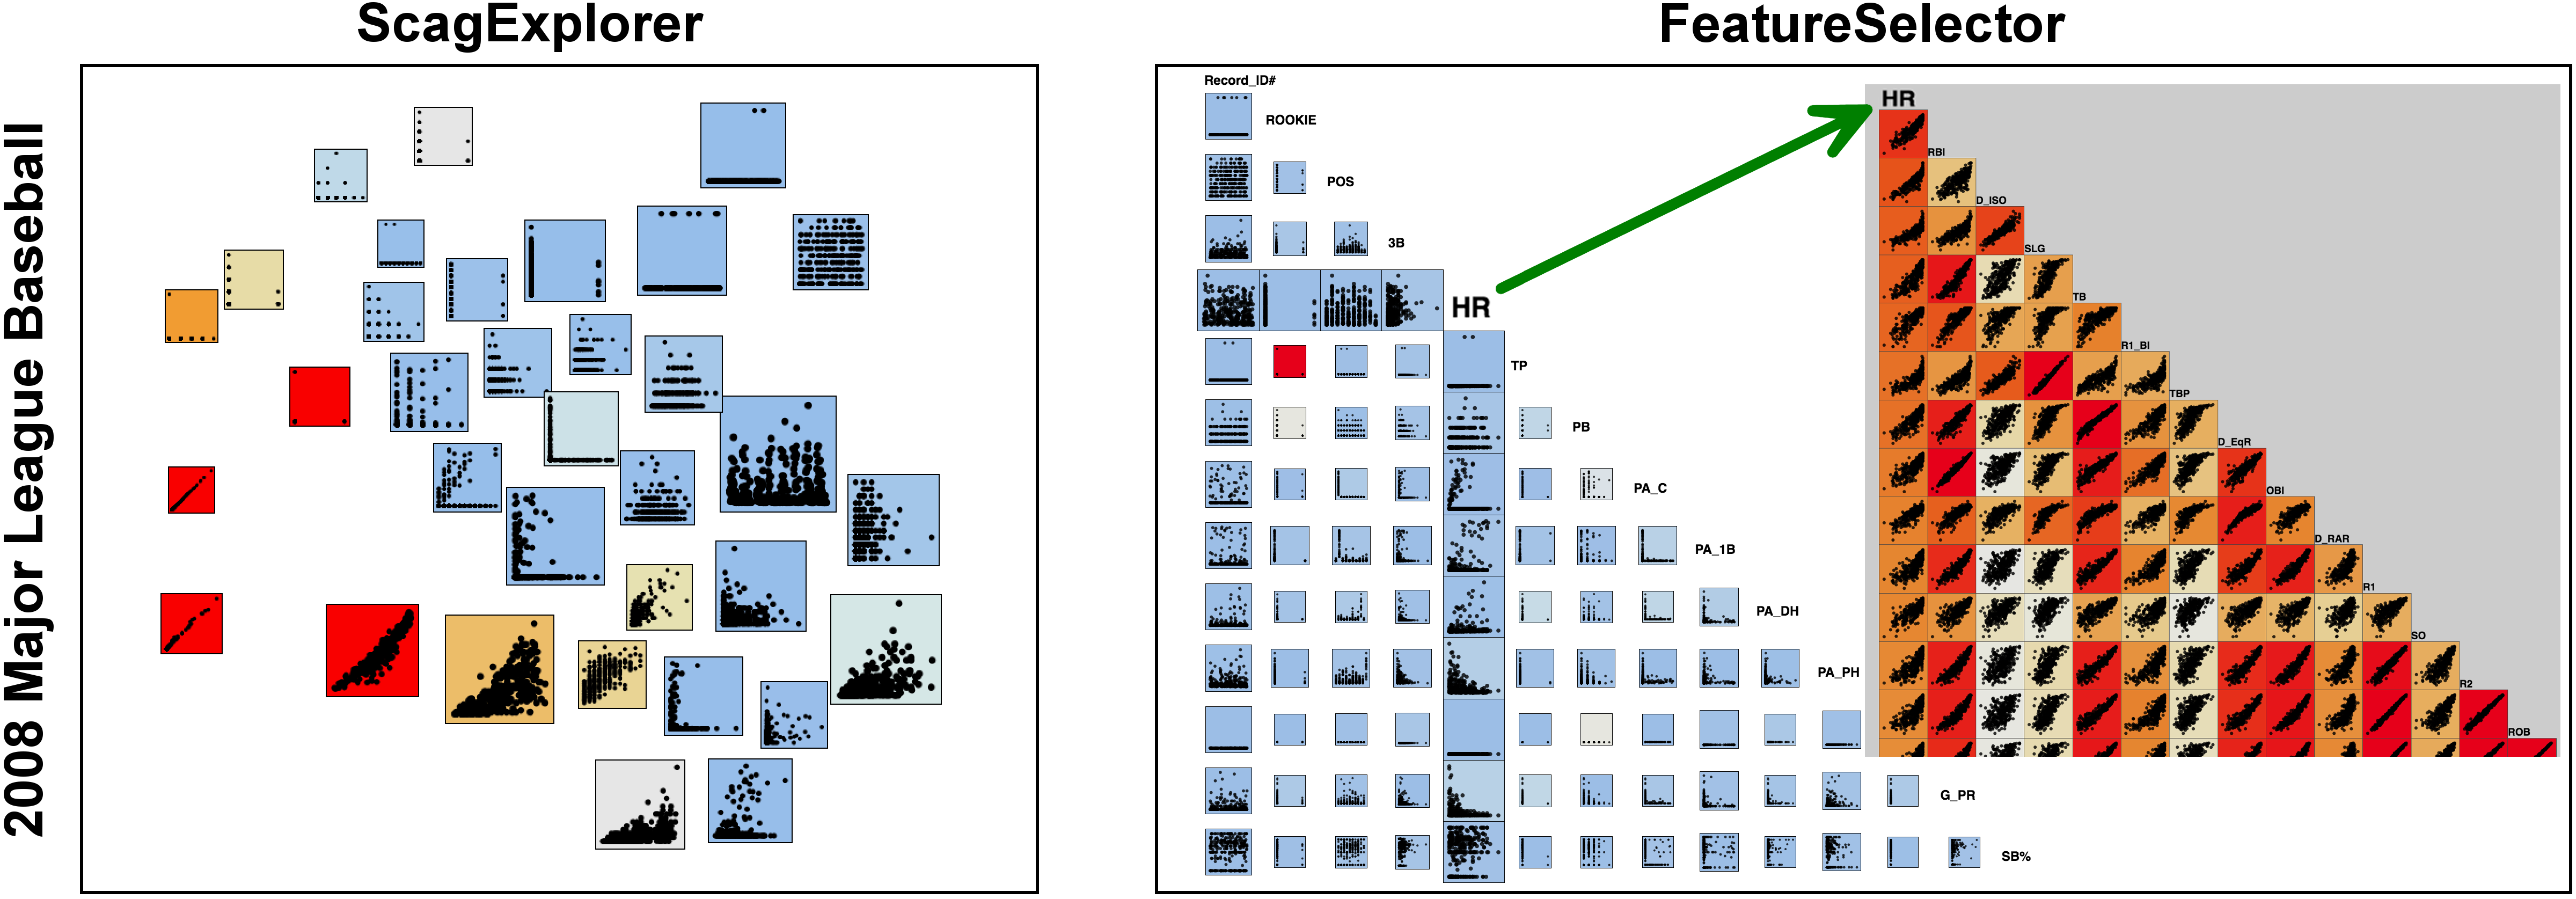
Major League Baseball in the 2008 season
The main idea of FeatureSelector is to cluster groups of variables based on the "Scagnostics signature", namely the distance between two variables is measured by how different their Scangostics are to the rest of the variables. The summary SPLOM among the representatives are formed as depicted in the right panel. Details within each cluster can be shown as another SPLOM by closing on any diagonal entry of the original SPLOM (origin of green arrow). As depicted, NOT all member variables (target of green arrow) are strongly correlated but they are grouped together by sharing similar-behaving features w.r.t. other variables.Communities and Crime data
The Communities and Crime data set contains 128 different dimensions and contains 1994 items describing various crime and non-crime related attributes of communities in the United States of America.The details between two clusters can be shown as a rectangle array of scatterplots by closing on an off-diagonal entry of the SPLOM (the scatterplot of Var 6 vs. Var 18). The consistent patterns of these pairwise projections explain why these redundant variables should be clustered together so that users can focus on important variables in the summary SPLOM.